Axis Tactics 12th November, 2024 - A comment on US Equities and Global Bonds
A comment on US Equities and Global Bonds
If you already maintain an active portfolio or trading account with one of our Group Companies, please reach out to your usual contact or otherwise via email on info@axis-im.com, for a full access code to all sections in this Newsletter. For more information on what we do and the services we offer, please visit www.axis-im.com.
US Equities and Global Bonds
Buying into the sharp fall on US Bonds last week has paid off thus far, with US 10-Year Yields falling back from over 4.45% to 4.28% earlier this week. In cash terms, that corresponds to almost 2 full points of unleveraged upside and 7-10% profit on a typical futures contract or Bond ETF (CFD), within a week.
Similarly, our call to fade the equity rally (short selling, reducing long positions, taking profits - as per your own risk preference) is going to plan so far, with the UK, Europe and Tech all dropping back after the initial euphoria.
Charts on the US Equity Outlook - How far can this rally in US Equities go?
"Markets can remain irrational longer than you can remain solvent," John Maynard Keynes
At this point, we don’t think we have reached irrationality or even irrational exuberance as Alan Greenspan once described US equity price action.
However, as asset allocators over medium and longer term time-frames as well as tactical investors, it would be remiss if we didn’t refer back to our own position of 8th October, where we are sceptical of passive index holding returns over the coming 3-5 years.
Put another way, leaving it to your banker to invest in some index trackers may give you peace of mind - but such an approach is unlikely to perform anything like as well in the coming 5 years as it may have done in the preceding 5 years.
Only a precise and targeted investment approach is likely to work from this point forward.
Valuations…..
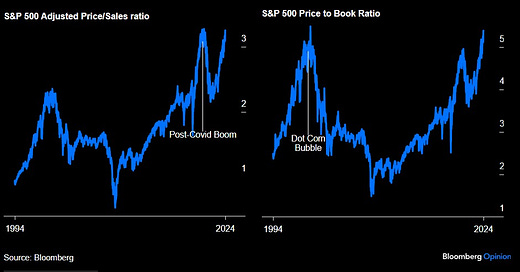
The above graphic (created on Bloomberg Opinion) illustrates where the current valuation of the S&P 500 sits, in relation to some key historic moments. Most readers will remember the very strong rally in global stock markets in post-Covid and a few might recall the collapse that followed. Using a Price to Book Ratio, the S&P 500 is now at the same elevated valuation level as the time of the Dot-Com bubble.
Q : Does that mean the market will crash? Do we think the market will crash? Surely not?
A: Maybe - and we have contingency plans for those events. But that’s not important right now (unless you have an interest in hedging or tactically trading events such as these)
What is much more important is what this valuation signifies for forward returns from this point. And the higher the valuation entry point, the lower the future returns and the probability of strong future years diminishes.
Politics…
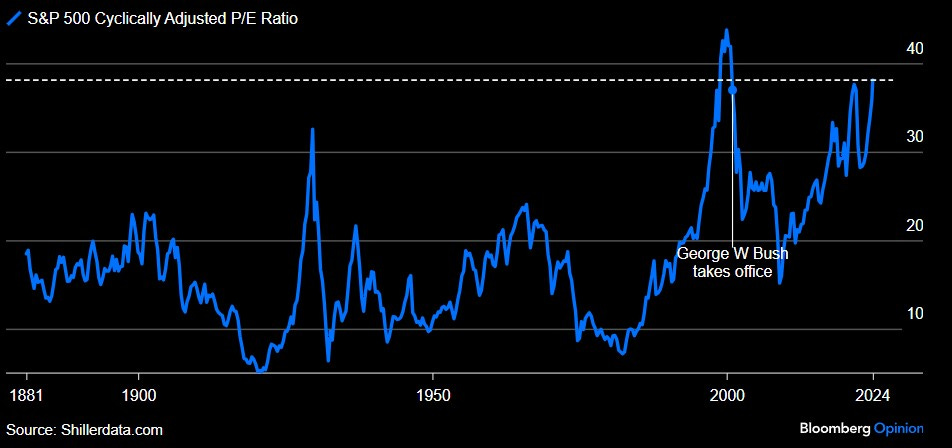
Only a quick comment on this one (from Bloomberg Opinion), After President George W Bush checked in, look at the drop that followed. And, we are pretty high up on this chart at the moment.
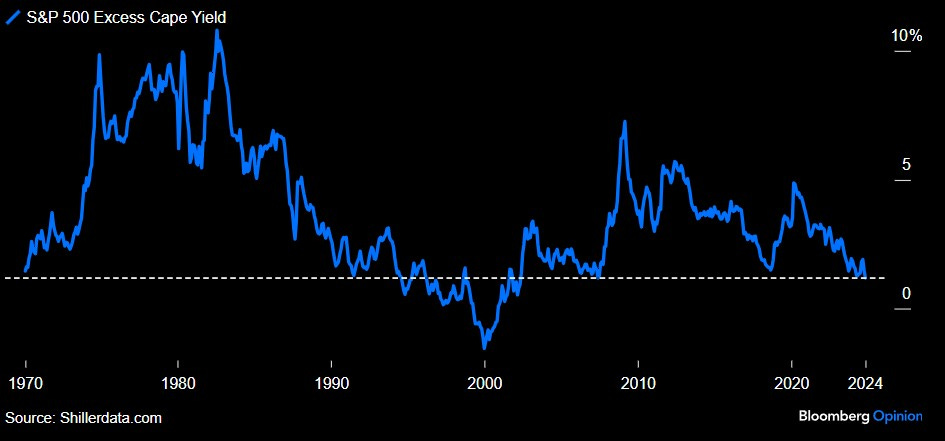
Stock Investors - Are you being paid to play?
From this graphic (Bloomberg Opinion), it appears not. Why buy risk assets if there is no danger money available for taking such risk? The excess yield from stocks as compared with safer bonds is on it’s lowest ebb in history, with the exception of the 2000 recession and market collapse. Put another way, stocks are so highly priced at the moment, that their yields and forward returns are compressed to historic lows.
And one more thing….
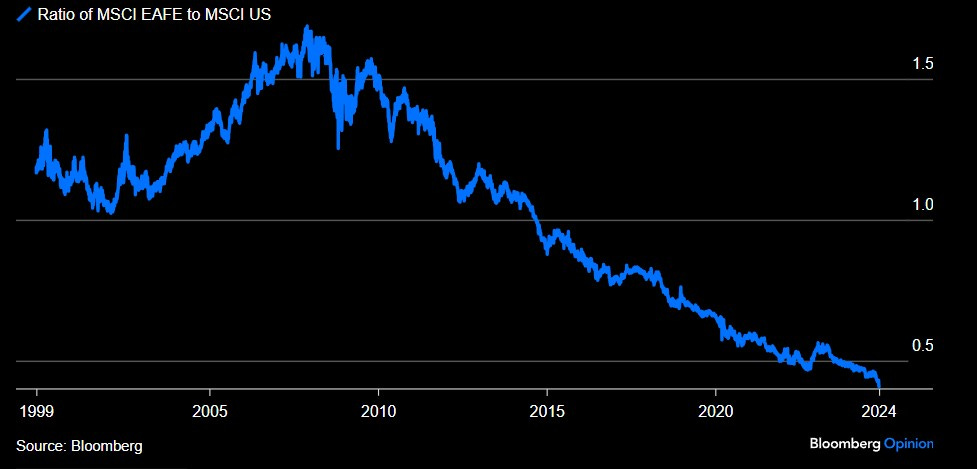
US Exceptionalism, captured in a single chart (created on Bloomberg Opinion). The downtrend illustrates how the Europe, Middle Eastern, Asian and African markets have underperformed when compared with the US. There are 2 matters to raise here.
Firstly, if the US markets do correct, what is the likelihood that EAFE/EMEA markets appreciate despite that? And secondly, is there a turning point up ahead where the World starts to outperform the US?
Our view is that the correlation is broadly intact across equities, over long time periods. So, the above graphic will assist in forecasting relative performance between regions - therefore EMEA/EAFE falls when the US falls. We have no indications that there is a turning point and operate on the basis that “the trend is your friend, until it ends”.
Other indicators that we follow, as well as the US Dollar, guide us on when and how to allocate capital across these markets.
Indexing, based on the above graphics, is not winning.
Typically, precise and timely recommendations for trading positions and investments across asset classes will be in the section below. Please reach out to your usual contact for access.
Keep reading with a 7-day free trial
Subscribe to The Axis Tactics Newsletter to keep reading this post and get 7 days of free access to the full post archives.


